Network viewer
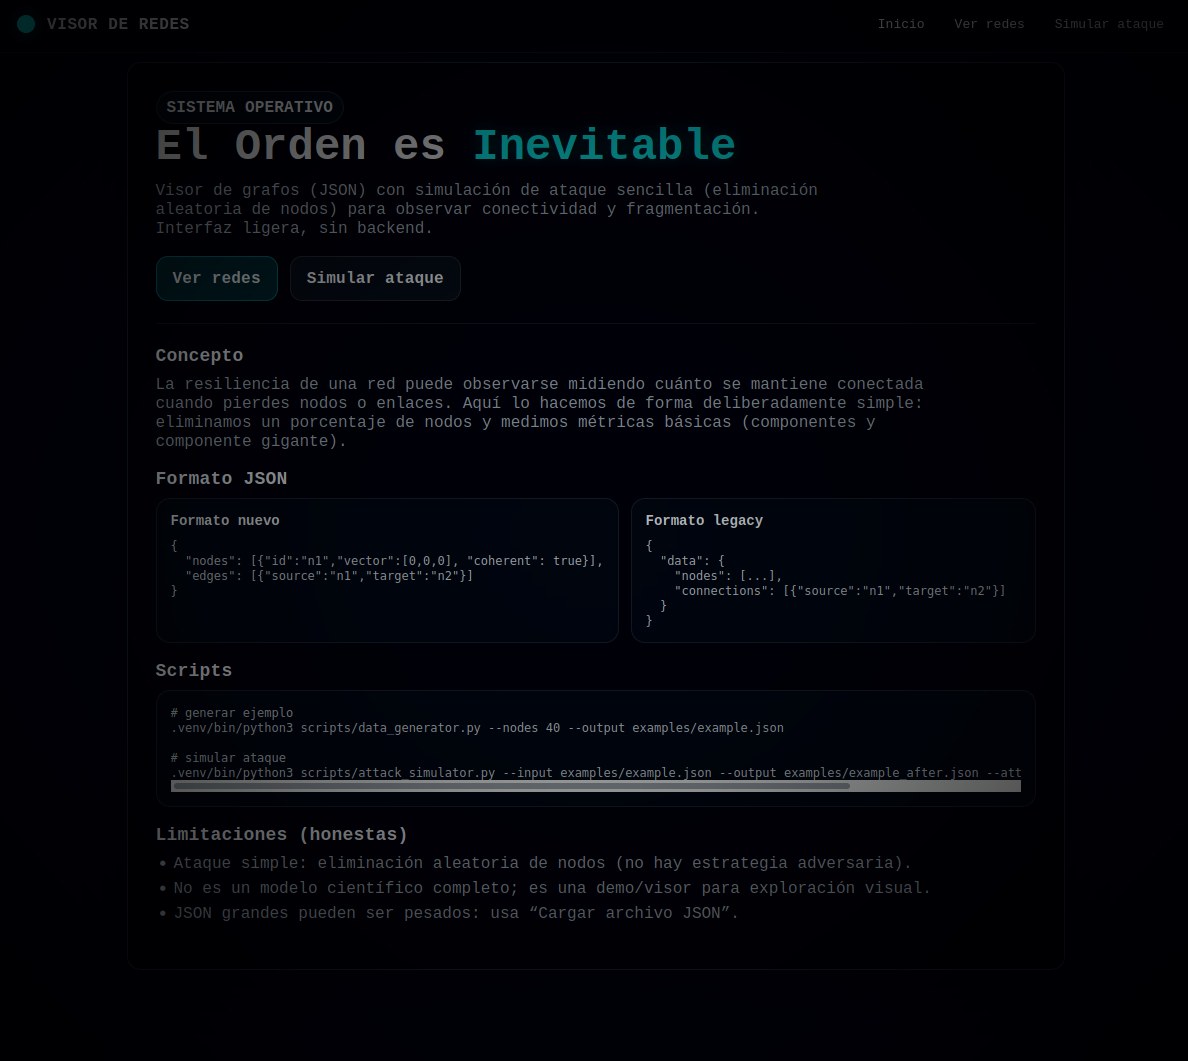
Static web app to load JSON graphs, visualize them in 3D, and explore resilience with a simple attack simulation (random node removal). Includes ready-to-run examples and optional scripts to generate data.
Technologies
Roles
Results and Achievements
- Built a static demo (no backend) with an end-to-end flow: JSON → 3D visualization → simulation.
- File-based JSON upload (no copy/paste) and ready-to-run examples.
- Minimal, maintainable structure:
assets/(theme), HTML pages, andscripts/for generation/attack.
What it is
Network Viewer is a backendless technical demo to load a graph in JSON, render it in 3D, and simulate a basic attack by randomly removing nodes to observe connectivity changes.
How to use it
- Open the demo.
- Load a
.jsonfile via “Load JSON file”. - (Optional) Run the attack simulation from the simulator page.
Notes
- Honest demo: the attack model is intentionally simple.
- The repository includes example files to test in under a minute.
Context
This project stems from an interest in network theory and the visualisation of complex structures. The goal was to build a lightweight, serverless tool that allows loading any graph in JSON format, exploring it visually in 3D, and observing how its structure responds to node removal.
Challenge
Representing graphs in interactive 3D, accessible from the browser with no backend or installation. The viewer had to support variable-size JSON files, offer an understandable attack simulation, and maintain a minimal, maintainable code structure.
Technical decisions
Fully static app for maximum portability (static hosting / GitHub Pages) and minimal maintenance. File-based JSON input to avoid copy/paste and support larger graphs. 3D visualisation with Three.js for node and edge rendering. Intentionally simple attack simulation: random node removal to observe connectivity and fragmentation changes. Auxiliary Python scripts with NetworkX for generating example graphs.
My role
End-to-end design, development and documentation: application architecture, HTML/CSS/JS frontend, Three.js integration for 3D rendering, Python scripts for data generation and simulation, and technical documentation with bilingual dossier.
Limitations and evolution
The attack model is intentionally simple — no adversarial strategy is included. This is not a full scientific model but an exploration demo. Possible evolution: targeted attacks (by degree, centrality), quantitative resilience metrics, and support for additional graph formats.
Interested in this project?
If you need more technical information, additional documentation, or want to discuss a collaboration, feel free to contact me.
Request information